 admin
admin
If you want to understand whether a stock looks expensive or cheap compared with its earnings, the P/E ratio is one of the first numbers to learn. The question what is p/e ratio in share market with example becomes much easier once you understand the simple relationship between a company’s share price and its earnings per share (EPS).
P/E stands for Price-to-Earnings ratio. It compares the current market price of one share with the earnings generated per share. The U.S. Securities and Exchange Commission’s Investor.gov explains that P/E is calculated by dividing the current stock price by earnings per share.
For beginners, P/E can provide a quick way to compare companies, but it should not be used alone. A stock with a low P/E is not automatically a bargain, while a high P/E does not always mean a stock is overpriced.
What Is P/E Ratio in Share Market?
The P/E ratio tells you how much investors are paying for each unit of a company’s current earnings.
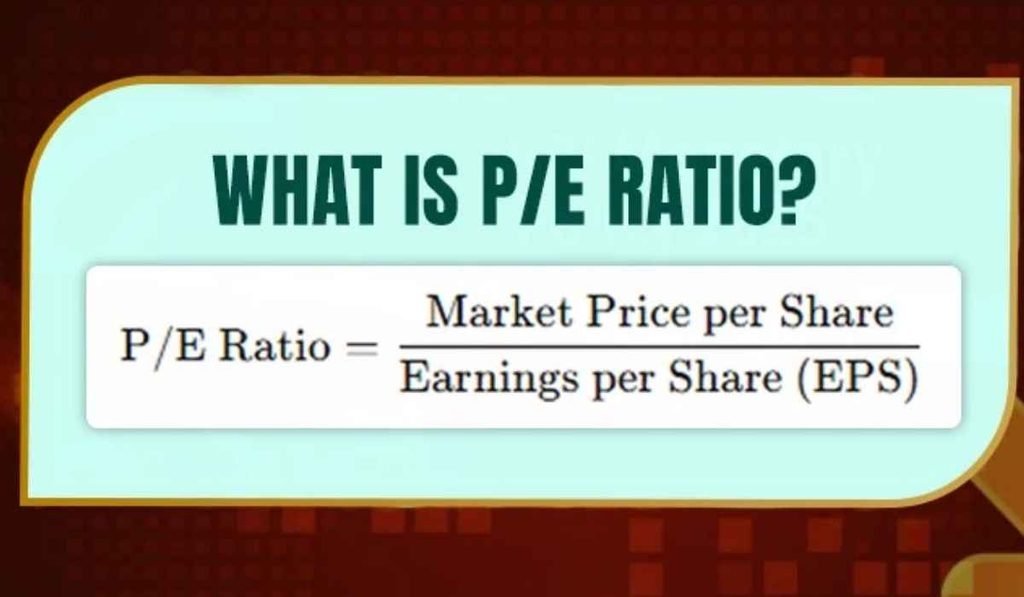
The basic formula is:
P/E Ratio = Market Price Per Share ÷ Earnings Per Share (EPS)
For example, suppose a company has:
- Share price: $100
- Earnings per share: $5
The calculation would be:
$100 ÷ $5 = 20
So, the company has a P/E ratio of 20.
In simple terms, investors are paying 20 times the company’s annual earnings per share at the current market price.
The earnings figure is commonly based on the company’s earnings over the previous 12 months when calculating a trailing P/E. Investor.gov defines EPS using earnings for the past 12 months divided by common shares outstanding.
P/E Ratio Formula With a Simple Example
Understanding the formula is easier with a real-world style example.
Imagine Company A has a share price of $60. Its annual earnings per share are $3.
Using the formula:
P/E = $60 ÷ $3
P/E = 20
This means Company A trades at 20 times its earnings.
Now imagine Company B has a share price of $80 and EPS of $8.
P/E = $80 ÷ $8
P/E = 10
Although Company B has a higher share price, its P/E ratio is lower because it earns more per share relative to its stock price.
Quick P/E Example
| Company | Share Price | EPS | P/E Ratio |
| Company A | $60 | $3 | 20 |
| Company B | $80 | $8 | 10 |
| Company C | $120 | $4 | 30 |
This shows why looking only at the stock price can be misleading. A $120 stock is not necessarily more expensive in valuation terms than a $60 stock. Earnings must also be considered.
What Does a P/E Ratio of 20 Mean?

A P/E ratio of 20 means the stock is trading at 20 times its earnings per share.
It does not mean that an investor will automatically get their money back in 20 years. P/E is a valuation multiple, not a guaranteed investment return or payback period.
A P/E ratio can help investors understand how the market values a company’s earnings compared with:
- Its own historical P/E
- Similar companies
- An industry average
- Expected future earnings
FINRA notes that valuation analysis can involve several measures and that context matters because different industries can have different normal valuation levels.
Why Is the P/E Ratio Important?
The P/E ratio is popular because it connects two easy-to-understand numbers: stock price and earnings.
Investors can use it as an initial screening tool when researching companies.
For example, suppose two companies operate in the same industry:
- Company A has a P/E of 12
- Company B has a P/E of 28
At first glance, Company A appears cheaper relative to its current earnings. But that does not automatically make it the better investment.
Company B might have:
- Faster revenue growth
- Higher profit margins
- Lower debt
- Stronger competitive advantages
- Better expected earnings growth
Company A could also have a low P/E because investors expect its earnings to decline.
This is why the P/E ratio should be viewed as a starting point rather than a final answer.
What Is a Good P/E Ratio?

There is no single P/E number that is considered good for every stock.
A P/E of 10 might be low for one industry but normal or even high for another. Technology companies, utilities, banks, manufacturers, and other industries can have very different valuation patterns.
A better approach is to compare a company’s P/E with relevant benchmarks.
Useful Comparisons
When reviewing a P/E ratio, consider:
- Industry peers: Compare companies with similar business models.
- Historical P/E: Check how the company’s current valuation compares with its own past.
- Growth: Look at expected earnings and revenue growth.
- Profitability: Review margins and returns.
- Debt: Consider whether heavy debt affects future earnings.
- Cash flow: Check whether reported profits are supported by cash generation.
FINRA specifically advises investors to look at multiple valuation measures and compare current metrics with historical values and industry averages rather than viewing a single ratio in isolation.
High P/E vs Low P/E
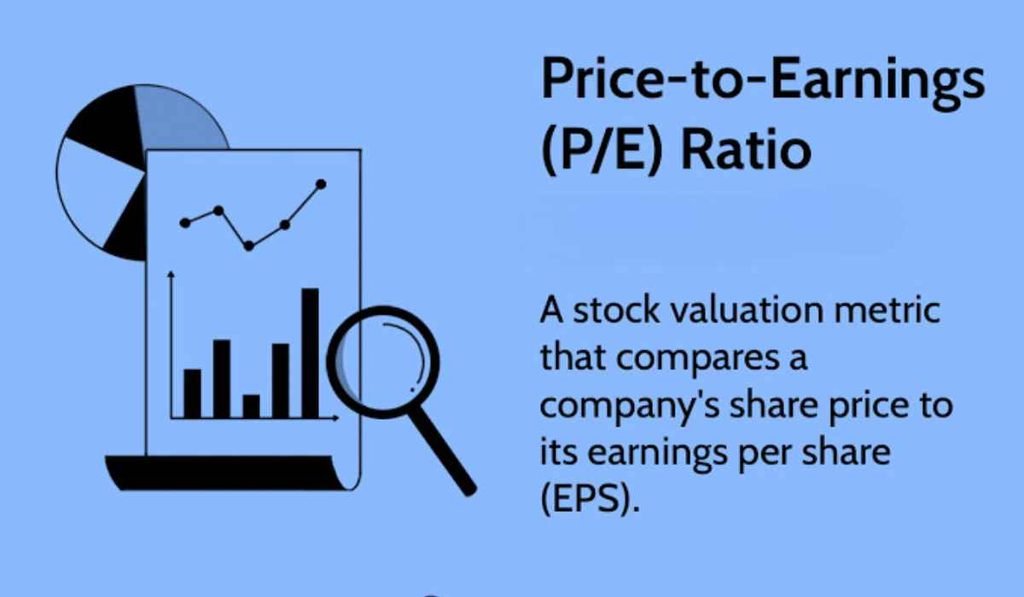
A high or low P/E can tell you something about how the market values a company’s earnings, but it does not tell the whole story.
High P/E Ratio
A high P/E can occur when investors expect strong future growth.
For example, if a company is growing rapidly, investors may be willing to pay a higher price for each dollar of current earnings because they expect future earnings to increase.
However, a high P/E can also create risk if the company’s expected growth does not happen.
Low P/E Ratio
A low P/E may mean a stock is priced cheaply relative to its current earnings.
But there could be a reason.
The company might be facing:
- Falling sales
- Lower profit margins
- High debt
- Industry problems
- Regulatory challenges
- Weak future earnings expectations
This is sometimes called a value trap, where a stock appears cheap but its underlying business continues to deteriorate. FINRA highlights value traps as an important concern when using valuation measures.
What Is Trailing P/E and Forward P/E?
Two common versions of the P/E ratio are trailing P/E and forward P/E.
Trailing P/E
Trailing P/E uses earnings that the company has already reported, generally covering the previous 12 months.
For example:
Current share price ÷ earnings per share from the past 12 months
Because it uses actual historical earnings, it is based on information that has already occurred.
Forward P/E
Forward P/E uses estimated future earnings.
For example, a company may currently trade at $100 per share. Analysts expect it to generate $6 in EPS over the next year.
The forward P/E would be:
$100 ÷ $6 = 16.7
Forward P/E can be useful when comparing valuation with expected earnings, but estimates can change and may not be accurate.
FINRA’s analyst materials identify both forward P/E and LTM, or last-twelve-month, P/E among valuation measures used in financial analysis.
What Is P/E Ratio in Share Market With Example for Beginners?
For a beginner, the easiest way to understand the ratio is to imagine buying a small piece of a business.
Suppose a company earns $10 million per year and has 1 million shares.
Its EPS is:
$10 million ÷ 1 million = $10 EPS
If its stock trades at $200 per share:
$200 ÷ $10 = 20 P/E
The market is therefore valuing each share at 20 times its current annual earnings per share.
Now suppose the company grows its earnings to $15 per share while the stock remains at $200.
The new P/E becomes:
$200 ÷ $15 = 13.3
The share price did not change, but the P/E fell because earnings increased.
This example shows why P/E can change even when the stock price stays the same.
What Does a Negative P/E Mean?
A company can have a negative P/E when it reports negative earnings.
For example:
- Share price = $50
- EPS = -$2
Mathematically, the result would be -25.
However, negative P/E figures are generally not useful in the same way as positive P/E ratios because the company is losing money.
When a business has negative earnings, investors may need to examine other measures such as:
- Revenue growth
- Gross margin
- Operating cash flow
- Free cash flow
- Debt
- Cash reserves
- Expected path to profitability
A P/E ratio works best when earnings are meaningful and reasonably representative of the company’s ongoing business.
P/E Ratio vs Other Valuation Ratios
P/E is only one valuation tool. Analysts may also examine price-to-book, price-to-free-cash-flow, EV/EBITDA, price-to-sales and other measures. FINRA lists several of these as common valuation metrics used in financial analysis.
| Ratio | Basic Comparison | Often Useful For |
| P/E | Price vs earnings | Profitable companies |
| P/B | Price vs book value | Asset-heavy businesses |
| P/S | Price vs sales | Companies with low or no profits |
| EV/EBITDA | Enterprise value vs EBITDA | Comparing businesses with different debt levels |
| P/FCF | Price vs free cash flow | Cash-generating companies |
Using several measures can provide a clearer picture than relying on one number.
Common Mistakes When Using P/E
Many new investors make the same mistakes when they first learn P/E.
Mistake 1: Assuming Low P/E Means Cheap
A low P/E can reflect weak future expectations. Always investigate why the multiple is low.
Mistake 2: Comparing Different Industries
Comparing a bank with a software company based only on P/E may provide little useful information.
Mistake 3: Ignoring Earnings Quality
One-time gains can temporarily increase earnings and make the P/E look unusually low.
Mistake 4: Ignoring Growth
A company growing earnings quickly may reasonably trade at a higher P/E than a slow-growing competitor.
Mistake 5: Using P/E Alone
A stronger analysis also considers financial statements, cash flow, debt, business conditions and future expectations. FINRA recommends using company filings and financial information as part of stock due diligence.
How to Use P/E Ratio When Researching a Stock
A simple process can make P/E more useful.
Step 1: Find the current share price.
Step 2: Check the company’s EPS.
Step 3: Calculate or verify the P/E ratio.
Step 4: Compare it with similar companies.
Step 5: Check the company’s historical P/E.
Step 6: Review revenue and earnings growth.
Step 7: Examine debt and cash flow.
Step 8: Look at future earnings expectations.
Step 9: Read recent company filings and disclosures.
This process gives you more context than simply searching for the lowest P/E stock.
What Is P/E Ratio in Share Market With Example in Simple Terms?
Put simply, P/E tells you how much the market is currently paying for each dollar of a company’s earnings.
If a stock costs $50 and earns $5 per share, its P/E is 10.
If another stock costs $100 and earns $5 per share, its P/E is 20.
The second company costs twice as much per share while generating the same earnings per share. That does not automatically make it a bad investment, because investors may expect stronger future growth or other benefits from the business.
The key is to understand why the P/E is where it is.
FAQs
- What is P/E ratio in share market with example?
- P/E is calculated by dividing a stock’s current share price by its earnings per share, such as $100 divided by $5 producing a P/E of 20.
- Is a high P/E ratio bad?
- No, a high P/E can reflect strong growth expectations, although it can become risky if expected growth fails to materialize.
- Is a low P/E ratio always good?
- No, a low P/E can result from weak business prospects, declining earnings, debt concerns or other risks.
- What is the difference between trailing and forward P/E?
- Trailing P/E uses past earnings, while forward P/E uses estimated future earnings.
- Can a company have a negative P/E ratio?
- Yes, a negative P/E can occur when a company reports negative earnings, although the ratio becomes less useful for valuation.
Learning what is p/e ratio in share market with example gives you a useful starting point for understanding stock valuations. Just remember that the number is most meaningful when you compare it with similar businesses, historical levels, earnings growth, debt and cash flow. A P/E ratio can help you ask better questions, but the rest of the company’s financial picture still matters.